
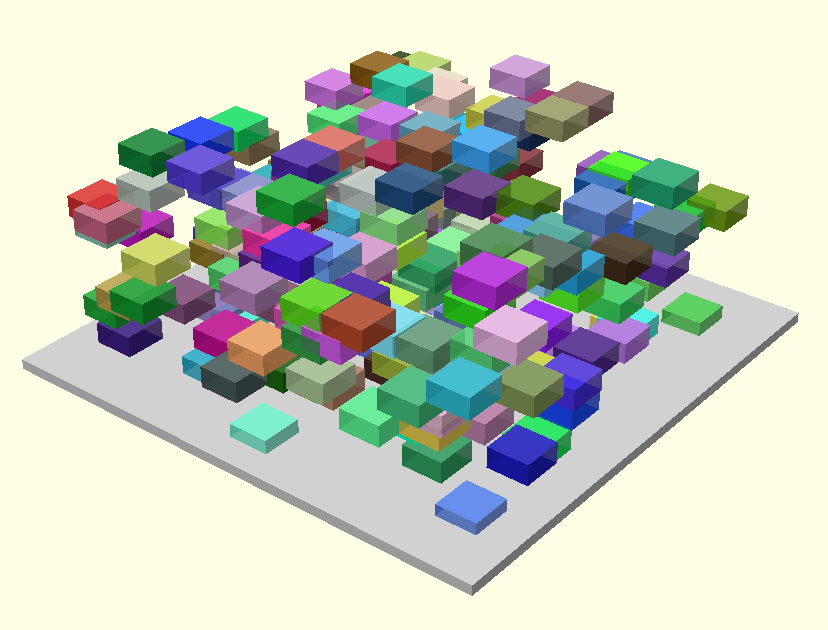
We randomly construct boxes in three-space varying number, size and density to get a feel for how complex a diagram can be and still expose its interior when viewed from the most advantageous angles.
See Share the Wonder for our anticipated platform.
We construct and view sample configurations using openSCAD's solid geometry primitives.
color("lightgray") cube([250,250,5],true); for(x=[-100:10:100]) for(y=[-100:10:100]) for(z=[5:10:100]) if(rands(0,100,1)[0]<5) translate([x,y,z]+rands(-2,2,3)) color(c=rands(0,1,3),alpha=.8) cube([20,20,10],true);
We find a diagram this complex can be viewed in its totality when freely zoomed and rotated in projection.
Now with real data queried from Neo4j, similar number of boxes, services stacked on the teams that own them, some hot with incidents. expand  github
 ![]()
Note that these screenshots are of a 3d interactive viewer where the pan, zoom and viewpoint are all adjustable. With skillful manipulation of these controls one can approximate what it will be like looking at similar diagrams projected into physical space.